Uncertainty is the only certainty in life. Whether you are investing in the stock market, forecasting the weather, or playing poker, you are constantly making bets on the future. Probability is the mathematical framework that allows us to make those bets intelligently.
Many people view probability as "luck". It isn't. It is the physics of information. It turns vague feelings like "maybe" or "unlikely" into precise numbers that can be calculated, compared, and optimized.
1. The Classical Definition
At its simplest level, probability is a ratio. If we assume every outcome is equally likely (like a fair die), the formula is simple:
Example: Rolling a Die
You want to roll a number higher than 4 (so, 5 or 6).
• Desired Outcomes: 2 (The 5 and the 6).
• Total Outcomes: 6 (1, 2, 3, 4, 5, 6).
• Probability: 2/6 = 1/3 ≈ 33.3%.
This "Classical Probability" works great for games of chance, but in the real world, outcomes aren't always equally likely. The probability of rain isn't 50% just because "it either rains or it doesn't."
2. The Law of Large Numbers
This is the rule that built Las Vegas.
The Law of Large Numbers states that while short-term results are random, long-term results are predictable.
- Short Term (10 flips): You might get 8 Heads and 2 Tails. This is noise.
- Long Term (1,000,000 flips): You will get almost exactly 50% Heads.
The Casino Edge:
In Roulette, the house has a small edge (about 5.26%). If you bet $100 once, you might win. The casino doesn't care. They care that 10,000 people bet $100 every night. Over that many trials, the "Luck" cancels out, and the "Math" takes over. The casino cannot lose in the long run.
3. The Gambler's Fallacy
This is the most expensive mistake in human history.
The Trap: "I flipped 5 Heads in a row. The next one MUST be Tails. It's due!"
The Reality: The coin has no memory. The probability of the next flip is still exactly 50/50. The universe does not owe you a Tail to "balance the books".
This applies to the stock market too. Just because a stock has gone down for 5 days doesn't mean it "must" go up tomorrow. Past independent events do not influence future independent events.
4. Independent vs Dependent Events
Understanding the difference here is critical.
Independent Events (Replacement):
You pick a card, look at it, put it back, shuffle, and pick again.
The odds never change. P(Ace) is always 4/52.
Dependent Events (No Replacement):
You pick a card and keep it. Now the deck has changed.
• Draw 1: P(Ace) = 4/52. (Assume you got an Ace).
• Draw 2: P(Ace) = 3/51.
• Draw 3: P(Ace) = 2/50.
This is the math behind "Card Counting" in Blackjack. When many low cards have been played, the remaining deck is rich in high cards/Aces, shifting the probability in favor of the player.
5. Conditional Probability and Bayes' Theorem
Life rarely asks "What is the probability of A?"
It usually asks "What is the probability of A, Given that B has happened?"
This is written as P(A | B).
The Medical Test Paradox:
Imagine a cancer test is 99% accurate. You test positive. Do you have a 99% chance of having cancer?
NO. It might be less than 10%!
How?
• Assume 1,000 people take the test. Only 1 actually has cancer.
• The 1 sick person tests Positive (99% accuracy).
• The 999 healthy people test... mostly Negative. But 1% of them get a False Positive. That is ~10 healthy people testing positive.
• So, out of 11 positive results, only 1 is real.
• P(Cancer | Positive) = 1/11 ≈ 9%.
This counter-intuitive result is calculated using Bayes' Theorem, which tells us how to update our beliefs when we get new evidence.
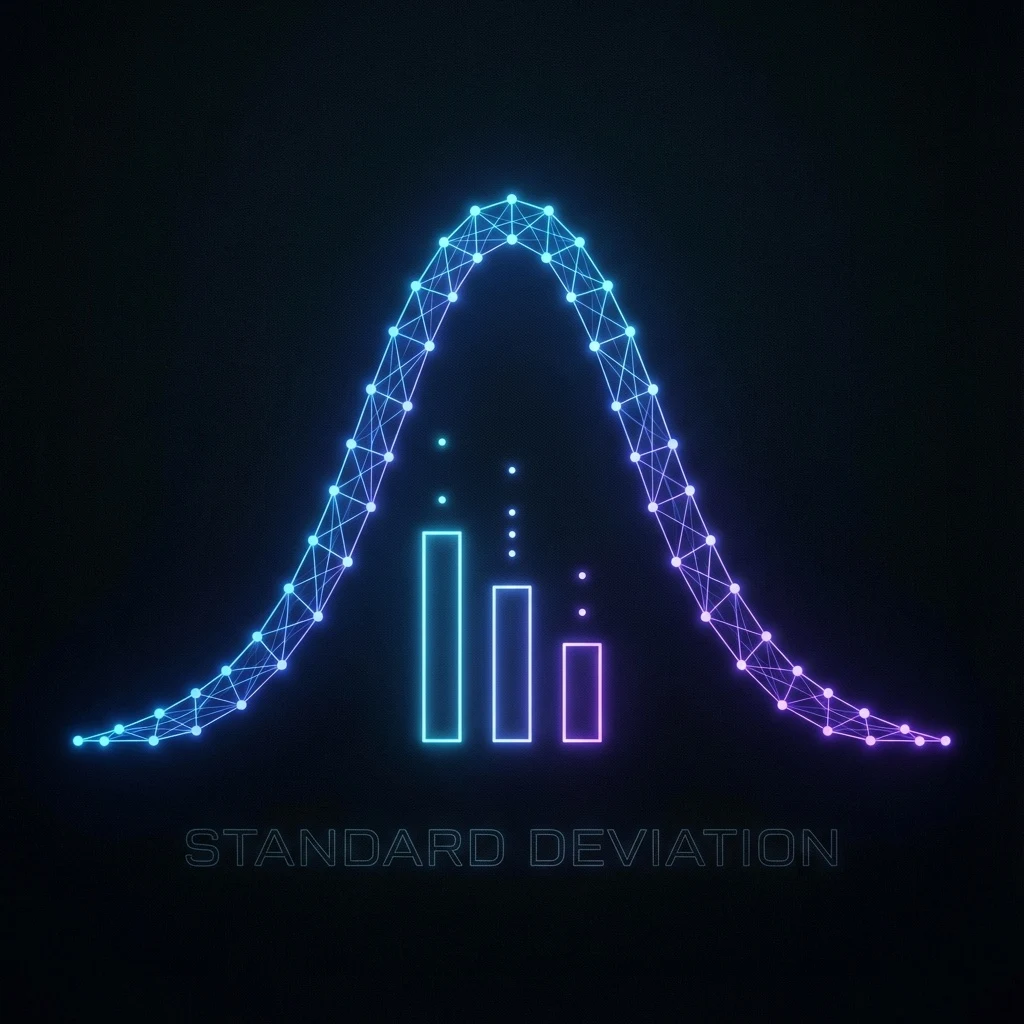
6. The Normal Distribution (The Bell Curve)
If you graph the height of every human on earth, you don't get a jagged line. You get a smooth, symmetrical hill. This is the Normal Distribution.
Nature loves averages. Extreme things are rare.
- 68% of data falls within 1 Standard Deviation of the mean.
- 95% falls within 2 Standard Deviations.
- 99.7% falls within 3 Standard Deviations.
If you are 3 Standard Deviations above the mean in IQ, you are a genius (Top 0.1%). If you are 6 Standard Deviations away ("Six Sigma"), you are a 1-in-a-billion anomaly. Manufacturing aims for Six Sigma to ensure almost zero defects.
7. Expected Value (How to Win)
Expected Value (EV) is the single most useful tool for decision making.
Formula: EV = (Win % * $Win) - (Loss % * $Loss).
The Lottery Example:
Ticket costs $2. Jackpot is $10 Million. Odds are 1 in 20 Million.
EV = (1/20m * $10m) - (100% * $2)
EV = $0.50 - $2.00 = -$1.50.
Every time you buy a ticket, you are mathematically setting $1.50 on fire.
Professional Poker players and Insurance companies live by EV. An Insurance company knows they will lose money on your car accident, but across 100,000 customers, the Expected Value is positive for them.
8. The Monty Hall Problem
Let's finish with a brain teaser.
There are 3 doors. 1 Car, 2 Goats.
1. You pick Door 1. (1/3 chance of Car).
2. Monty (who knows where the car is) opens Door 3 to show a Goat.
3. He asks: "Switch to Door 2, or Stay?"
You should SWITCH.
Why?
• When you picked Door 1, there was a 1/3 chance you were right, and a 2/3 chance the car was elsewhere (Doors 2 or 3).
• Monty eliminating Door 3 doesn't change your door's odds. It's still 1/3.
• That means the "Missing 2/3" probability has now collapsed entirely onto Door 2.
Switching doubles your expected value.
Conclusion
Probability is not about predicting the next coin flip. It is about understanding the architecture of chance. It helps us distinguish between skill and luck, signal and noise, and fear versus reality. It is the compass we use to navigate the unknown.